A packaging line that consistently runs at 80% of rated machine speed might seem like a success—until you realize that the benchmark for world-class lines exceeds 85% OEE, and that the gap between your planned production and actual output often exceeds 30 percentage points when measured honestly.
The single most common mistake in cartoner selection is using supplier-advertised “maximum boxes per minute” to size a line. That number is achieved under ideal conditions: perfect carton quality, consistent product dimensions, no infeed jams, and no operator breaks. Your actual production floor will never replicate those conditions.
This guide provides a structured method to calculate your true throughput requirement using OEE methodology, so you can avoid both underspecification (creating a permanent bottleneck) and overspecification (wasting capital on unnecessary capacity).
Most packaging machinery suppliers quote a single number—for example, “maximum speed 200 boxes per minute.” However, survey data covering 120+ pharmaceutical packaging lines across 2025 and early 2026 reveal that the median actual measured OEE for cartoning lines is approximately 52%, with the top quartile reaching 64% and the top decile achieving 70%. This means even well-performing lines run at only two-thirds of their rated capacity.
This gap between advertised speed and actual output exists because several loss factors accumulate in real-world operation:
| Loss Category | Description | Typical Impact on Rated Speed |
|---|---|---|
| Availability losses | Planned maintenance, changeovers, breakdowns, micro-stops under 5 minutes | 15-25% reduction |
| Performance losses | Running below rated speed due to product variations or infeed constraints | 10-20% reduction |
| Quality losses | Rejects from improper loading, sealing defects, or missing products | 1-5% reduction |
When these losses compound, a machine rated at 200 boxes per minute often produces 100-120 good cartons per minute in sustained operation. A 2023 academic case study on a carton production line found that availability alone ranged from 66% to 80% across different months.
The implication for your selection process is clear: sizing a line based on rated speed guarantees overestimation of capacity by at least 30-40%. The correct approach is to define your required sustained output first, then divide by a realistic OEE assumption to back-calculate the necessary rated speed.
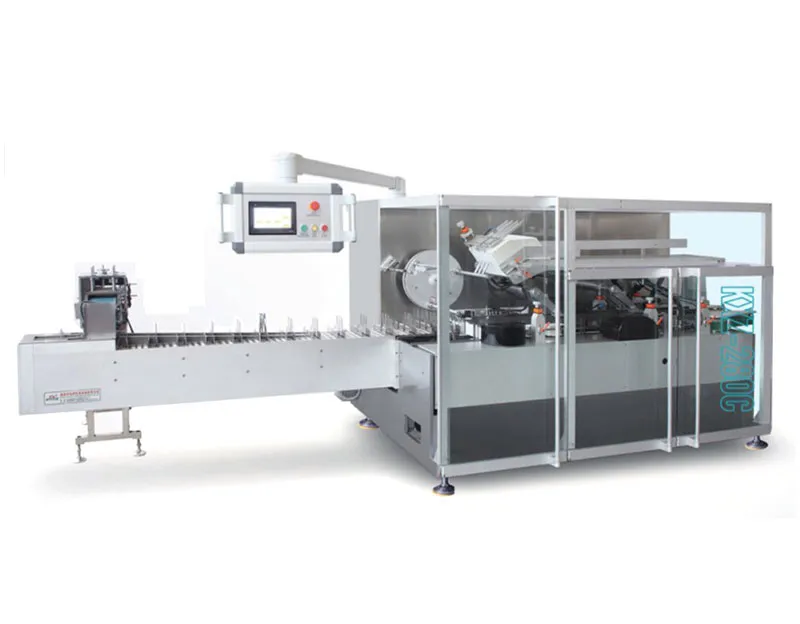
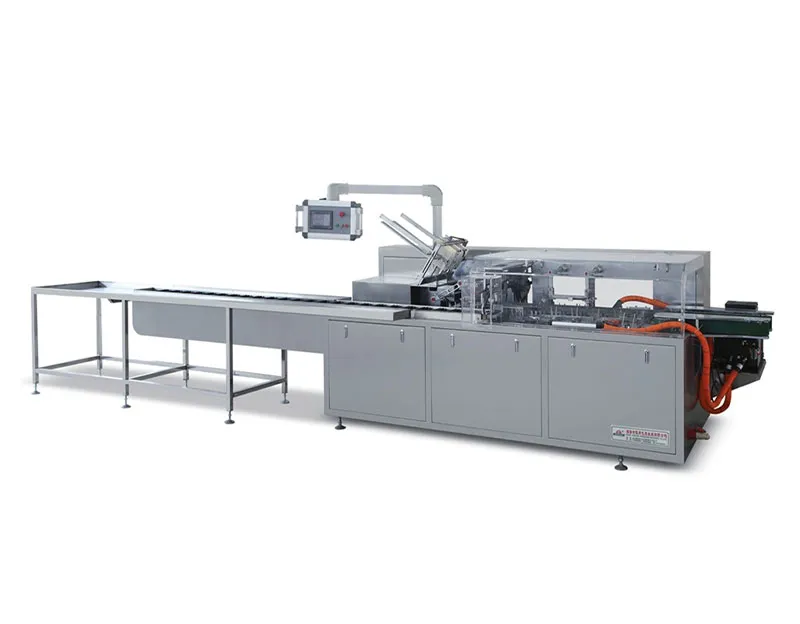
Once you determine your target sustained speed using the framework below, comparing different platforms’ actual performance characteristics—rather than just their peak claims—becomes the logical next step. You can review the motion types and speed ranges across automated cartoning platforms that are designed for sustained production.
View our Automated Cartoning Machine Product Series
Overall Equipment Effectiveness (OEE) is the industry-standard metric for measuring true production capacity. According to guidelines from PMMI—The Association for Packaging and Processing Technologies, OEE combines three factors: Availability, Performance, and Quality. Understanding each component is essential for accurate throughput calculation.
Availability measures the percentage of scheduled production time that the line is actually operating, accounting for:
Planned downtime (scheduled maintenance, shift changes, cleaning)
Unplanned downtime (breakdowns, jams, sensor failures)
Micro-stops (short interruptions under 5 minutes that are frequently under-logged in manual reporting)
Industry reference: For a well-maintained packaging line, availability should target ≥90%.
Example impact: If your line stops for 30 minutes of changeovers and 20 minutes of jams during an 8-hour shift (480 minutes), availability = (480 — 50) / 480 = 89.6%.
Performance measures actual operating speed relative to the machine‘s rated speed. Even when running, a cartoner may operate below its maximum due to:
Product characteristics (e.g., delicate items requiring slower insertion)
Infeed limitations (upstream machine output slower than cartoner capacity)
Operator adjustments to avoid jams
Industry reference: For a packaging line operating at target efficiency, performance should target ≥95%.
Example impact: A cartoner rated at 150 boxes/min that consistently runs at 120 boxes/min due to product handling constraints has performance = 120 / 150 = 80%.
Quality measures the proportion of produced cartons that meet specifications and can be shipped. Losses include:
Missing products (e.g., a stick pack missed in the collation)
Improper sealing (flaps not fully tucked or glued)
Misaligned labeling or printing errors
Industry reference: For modern automated packaging lines, quality should target ≥99.9%. However, complex cartoning applications may experience higher reject rates during changeover periods.
External source: According to the Pharma OEE Benchmark 2026 published by TeepTrak, based on direct-sensor OEE measurement across 120+ pharmaceutical packaging lines globally in 2025 and early 2026, the median measured OEE for cartoning and insert placement lines was 52%, while the top quartile reached 64% and the top decile achieved 70%. The benchmark further notes that plants using manual operator logs for downtime show the largest gap between reported and actual OEE, while plants using MES event capture achieve much closer alignment.
Instead of starting with a machine speed, begin with your business target and work backward through the OEE framework.
Calculate your daily production target based on sales forecasts or shift requirements. Be honest: include future growth projections.
| Question | Your Answer (Example) |
|---|---|
| What is your highest-volume product‘s monthly target (good cartons)? | 2,000,000 cartons/month |
| How many operating days per month? (Allow for weekends off, holidays) | 22 days |
| Required good cartons per day | 90,900 cartons/day |
Account for all time when operators are present, and the line could run, but subtract mandatory non-production periods.
| Variable | Example Value |
|---|---|
| Shifts per day | 2 shifts |
| Hours per shift | 8 hours |
| Total scheduled time | 16 hours |
| Minus: Planned maintenance (2 hours/day) | —2 hours |
| Minus: Breaks and shift handovers (1 hour/day) | —1 hour |
| Available production time | 13 hours |
Do not use the theoretical “world-class” 85% OEE for your initial calculation unless you already operate a mature, well-optimized line. Use stepwise targets based on your current operational maturity.
| Operational Maturity | Realistic OEE Target |
|---|---|
| New line, no optimization yet | 50-60% |
| Stable line with basic maintenance | 65-75% |
| Well-run line with OEE monitoring | 75-85% |
| World-class optimized line | 85%+ |
For comparison, TeepTrak‘s benchmark data across 120+ pharmaceutical packaging lines found that top decile lines achieving 70% OEE already place in the industry’s top performance tier—demonstrating how challenging sustained high OEE is in practice.
Use this formula to work backward:
Required rated speed ≥ (Required good cartons per day) ÷ (Available production hours × 60 minutes × OEE target)
Example calculation:
Required good cartons/day: 90,900
Available production time: 13 hours
OEE target: 65% (realistic for a new line with good practices)
Numerator: 90,900 ÷ (13 × 60 × 0.65) = 90,900 ÷ (780 × 0.65) = 90,900 ÷ 507
Required rated speed: 179 boxes/min
In this example, purchasing a machine rated at 150 boxes/min would leave you permanently short of the daily target. A machine rated at 200 boxes/min provides a buffer and allows for future growth.
Use this checklist when documenting requirements for equipment suppliers.
| Step | Action Item | Documentation Needed |
|---|---|---|
| 1 | Define daily target good cartons (include 15-20% future growth buffer) | Sales forecast, shift schedule |
| 2 | Calculate available production hours (scheduled time minus planned downtime) | Shift calendar, maintenance schedule |
| 3 | Select realistic OEE target based on your operational maturity | Benchmark from Step 3 table above |
| 4 | Apply formula to find required rated speed | Completed formula |
| 5 | Verify with supplier: “What is the sustained speed for my product on your machine?” | Supplier written commitment |
| 6 | Request OEE data from supplier for similar installations | Reference installation list |
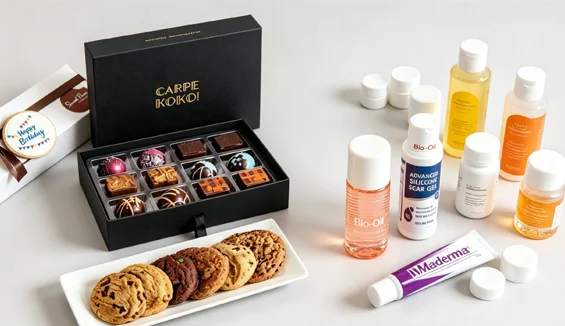
Specific product types significantly impact achievable throughput. Pharmaceutical cartoning lines encounter different constraints from food or daily chemical lines, especially regarding changeover validation and cleaning requirements. You can explore pharmaceutical product packing machines.
What goes wrong: Many buyers calculate required speed based on running one product continuously. In reality, most lines perform 1-5 changeovers per day. Each changeover consumes time without producing cartons.
How to avoid it: Adjust your available production hours downward by the cumulative time spent on changeovers.
Example correction: If your line performs three 30-minute changeovers per day, subtract 90 minutes from your available production time before applying the OEE formula.
What goes wrong: Supplier datasheets advertise peak speed—the absolute maximum achievable for a few minutes under perfect conditions. Production planning based on this number leads to chronic capacity shortfalls.
How to avoid it: When speaking with suppliers, always ask: “What is the sustained operating speed for my specific product, running an 8-hour shift, accounting for normal changeovers?” Request written confirmation. Reputable suppliers will provide a speed 15-25% lower than the peak rating.
You now have a method to determine required rated speed based on your business targets, available production hours, and realistic OEE assumptions. The next step is translating that number into specific machine specifications.
Before requesting detailed quotes from suppliers, prepare:
Your completed OEE calculation (required good cartons/day, available hours, target OEE, calculated rated speed)
Product dimension table (carton sizes across all SKUs, including minimum and maximum)
Changeover frequency (average number per day and target changeover time)
Infeed description (upstream equipment and its sustained output rate)
With these documents ready, you can evaluate supplier proposals based on sustained speed commitments rather than peak claims. This approach ensures you contract for the capacity you actually need, avoiding both expensive downtime and wasted capital.
If this throughput calculation guide was useful, the following articles will help you complete your cartoner evaluation:
Continuous-Motion vs Intermittent-Motion Cartoners: Speed, Stability, and Maintenance Trade-offs
Infeed System Design for High Speed Cartoners
Changeover Optimization: Reducing Downtime Between Batches
Understanding Cartoner OEE: A Practical Measurement Framework
Case Packing Cartoning: Options for Food and Supplement Lines
GET A QUOTE